Introduction
We are having a heatwave where I live, and all the news says it was the biggest in a LONG time. I already have some zigbee temperature and humidity sensors around in my home and feeding data to Home Assistant, so, I thought, how awesome would it be to have all this sensor data stored so I can compare them for the next heat waves?
Home Assistant stores all the sensors data in a SQLite database, but the thing is, by default only for 7 days, and it is not recommended to extend this time window. So what can we do?
A proper database
Yes, using a proper database for storing time-series data is the way to go in this case! So, at least two things cross my mind at this point: Which database to use? And, how to get the data off Home Assistant? One thing to keep in mind as well is that we are NOT replacing SQLite with another DB, they are meant to work together.
After a quick search, I soon realized that InfluxDB is the most common database that is used for this use-case, but, after another quick search I soon realized again that it is kinda heavy on storage and RAM usage… For that kind of application Victoria Metrics seems to do muuuch better in those regards, and best of all, it is a drop-in replacement for InfluxDB and Prometheus (which collects the data for InfluxDB) granting us assured compatibility. So without further ado, let’s get things going!
A detail about my setup
In my setup, I’ve opted to not have a dedicated box (like a raspberry) running Home Assistant Supervised, thus, I went down the Docker route, so all you see here will be directed to a setup like mine, using Docker and not Home Assistant’s supervisor. If you are running the supervisor, then check out this Victoria Metrics Addon, I’ve not tested it, but it should do the trick. After you get that configured, you can go straight to Configuring Grafana, and continue from there.
Victoria Metrics
We will run Victoria Metrics using docker compose, so, in a convenient place for you, create a docker-compose.yml file and paste the following on it:
version: "3.5"
services:
  vmagent:
    container_name: vmagent
    image: victoriametrics/vmagent:v1.94.0
    depends_on:
      - "victoriametrics"
    ports:
      - 8429:8429
    volumes:
      - <YOUR_PATH>/victoriametrics/vmagentdata:/vmagentdata
      - ./prometheus.yml:/etc/prometheus/prometheus.yml
    command:
      - "--promscrape.config=/etc/prometheus/prometheus.yml"
      - "--remoteWrite.url=http://victoriametrics:8428/api/v1/write"
    restart: always
  victoriametrics:
    container_name: victoriametrics
    image: victoriametrics/victoria-metrics:v1.94.0
    ports:
      - 8428:8428
    volumes:
      - <YOUR_PATH>/victoriametrics/vmdata:/storage
    command:
      - "--storageDataPath=/storage"
      - "--httpListenAddr=:8428"
      - "--retentionPeriod=100y"
      - "--selfScrapeInterval=60s"
    restart: always
  grafana:
    container_name: grafana
    image: grafana/grafana:9.2.7
    user: "1000:1000"
    volumes:
      - <YOUR_PATH>/grafana/grafanadata:/var/lib/grafana
    ports:
      - 3000:3000
So, we are defining three containers on that file. Let’s go through each one!
vmagent
vmagent is the drop-in replacement for Prometheus. It will be tasked with pulling the data from Home Assistant, and inserting it on Victoria Metrics DB. As seen in the volumes section of this container, we also need to provide a prometheus.yml file to it, so, on the same path as this docker-compose.yml file, create another file called prometheus.yml, and on it’s content, paste the following:
global:
  scrape_interval: 60s
  scrape_timeout: 20s

scrape_configs:
  - job_name: "hass"
    scrape_interval: 60s
    metrics_path: /api/prometheus
    bearer_token: "<YOUR_LONG_LIVED_TOKEN>"
    scheme: http
    static_configs:
      - targets: ['<HOME_ASSISTANT_IP:8123>']
Firstly, set the correct address for your Home Assistant instance, replacing <HOME_ASSISTANT_IP:8123> with it. Then, head over to Home Assistant, where we will generate the Long-lived token.
Generating token
In Home Assistant, click on your username on the left sidebar, and scroll all the way down until you see the Long-lived access Tokens section:
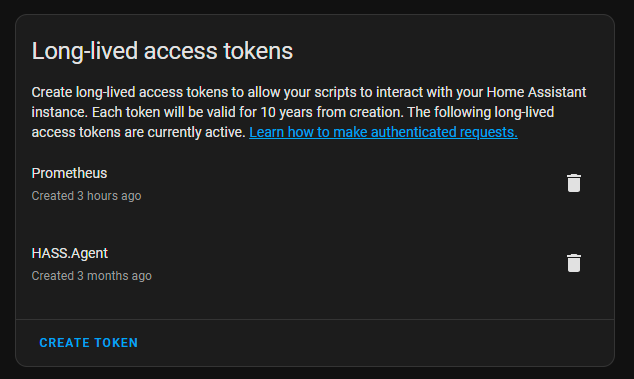
Create a new token, I suggest the name “Prometheus” or “VictoriaMetrics” to it, and when the token is shown on-screen DON’T close that pop-up until you’ve copied and pasted it to the config file, replacing <YOUR_LONG_LIVED_TOKEN> with it, as you cannot see it again.
Ok, with that out of the way, let’s check the next container.
victoriametrics
victoriametrics is the star of the show. It is the database that will store/query/whatnot our data. Not much going on here configuration-wise. The only thing to tweak is the following property, which specifies for how long the data will be retained:
"--retentionPeriod=100y"
As you can see, it is currently set to 100 years, or, in practice, indefinitely :P Tweak it to your heart (and storage) contents.
grafana
The last, but not least container in the list is Grafana, a tool that will allow us to build dashboards and graphs for our data. Again, not much config-wise going on here.
Do not start the containers yet.
Preparing Home Assistant
Ok, with all the files and configurations in place to retrieve and store our data, the next step is to expose them, and we will do it using the Prometheus integration, I found that it exposes the data in a much more neat way than using the InfluxDB integration directly. So, open your Home Assistant’s configuration.yml file and add the following to it:
prometheus:
  namespace: hass
  filter:
    include_domains:
      - sensor
      - climate
      - binary_sensor
    exclude_entity_globs:
      - sensor.iphone*
      - sensor.ipad*
      - sensor.sun*
      - sensor.echo_dot*
      - sensor.firetvstick*
      - sensor.this_device*
      - sensor.*connect_count*
      - sensor.*last_restart_time*
      - sensor.*linkquality*
      - sensor.*power_outage_count*
      - binary_sensor.iphone*
      - binary_sensor.ipad*
      - sensor.*last_restart_time*
      - sensor.*wifi_connect_count*
      - sensor.*mqtt_connect_count*
      - sensor.*restart_reason*
      - sensor.*signal*
      - sensor.*ssid*
      - sensor.sonoff_*_ip
There are a lot of entities in the exclude_entity_globs list, those are the ones that you DON’T want to be sent to Victoria Metrics. You can use wildcards like I did to match multiple sensors at once. And of course, that’s the config I am using, it certainly will be a bit different for you. So let’s tweak it! Save that file as-is, and restart Home Asssistant.
Tweaking exclude entities
After Home Assistant restarts, we will be able to query the Prometheus endpoint and check which sensors are present. Every sensor present in that response WILL be stored, so the idea here is to glance through the response and check if there is something else that you may want to exclude.
With the long lived token in hands, we will need to make a GET request to http://<HOME_ASSISTANT_IP:8123>/api/prometheus with the following header: Authorization: Bearer <TOKEN>. You can use whatever tool to accomplish this, but in this post, I’ll be using Postman. So, create a new request like the following: Set the URL as explained above (1), then for the header, go the Authorization tab (2), select the Bearer Token type (3), then paste the token in the field (4):
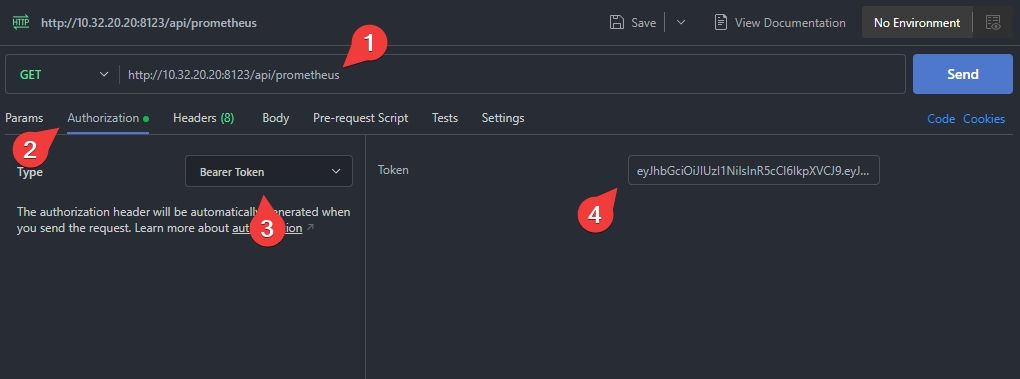
After that, hit the Send button, which will return a series of lines, which are your metrics! Skim through the file to check for unwanted data, and if you find any, be sure to add them to your Home Assistant’s configuration.yml file. Remember, on long-term storage every byte counts!
Starting Victoria Metrics
OK, now Home Assistant is exposing the data, so they are ready to be collected by vmagent! Open the docker-compose.yml we created earlier in this post and replace all the <YOUR_PATH> with the actual paths you want the data to be stored. Make sure to create all the <YOUR_PATH> directories and subdirectories before starting up the containers for the first time as well.
With all the paths properly set, we are ready to fire up all the containers! On new deployments, I usually run them for the first time in an attached terminal, then, detached if everything goes well. So, on your terminal run docker compose up, wait a bit for it to pull all the images, then start up, and then check for error messages. If all appears to be good, let’s move our attention to Grafana.
Configuring Grafana
On a browser navigate to http://<YOUR_SERVER_IP>:3000, you should be prompted with the grafana logo and a login form. Just type admin for the user and password. You should be requested to change the default password, do so.
After that, you should be at the main screen of Grafana. On the left side bar, hover the mouse over the cog, and click on Data Sources:
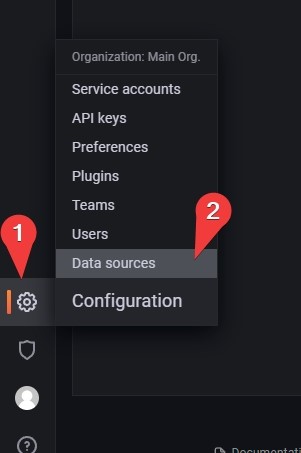
On the left of the page, there will be a blue button called Add data source, click it. Then, select Prometheus in the list.
You should be staring at a screen very similar to the following one, but without any data. Here you just need to update two fields:
Name, which should be set toVictoriaMetricsURL, which should be set tohttp://victoriametrics:8428
Like so:
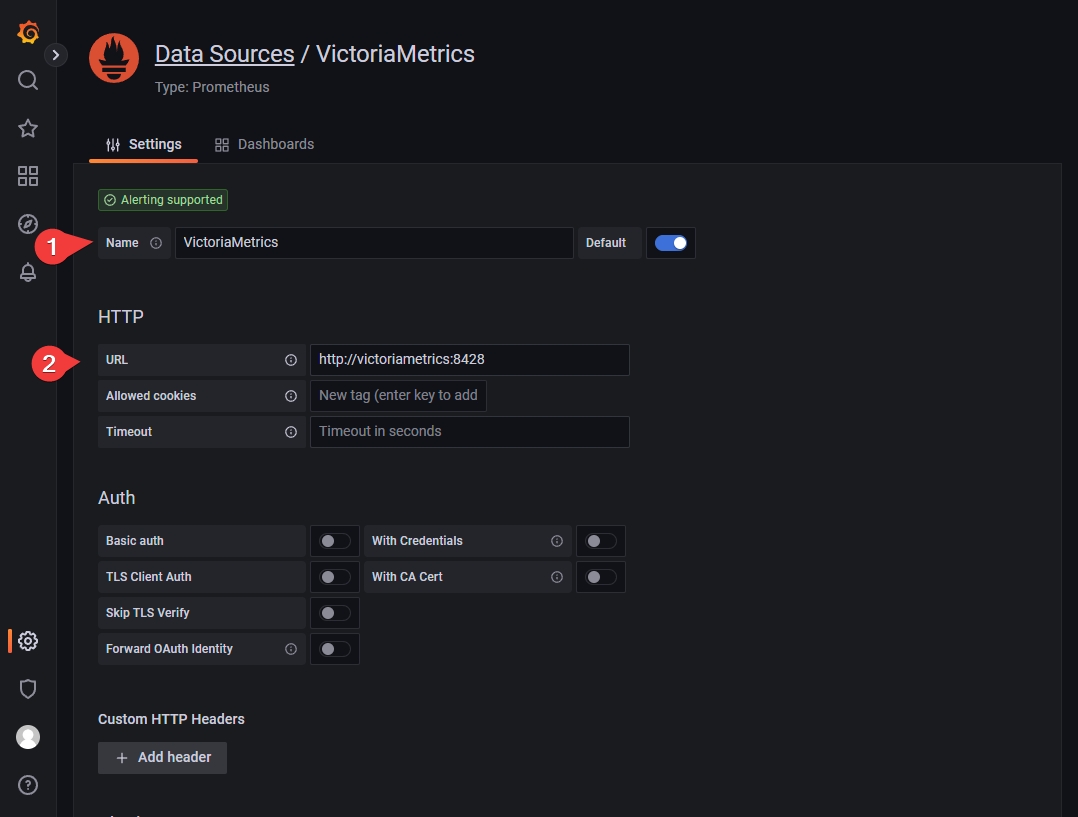
Head over to the footer of the page, and click the blue Save & Test button, it should succeed!
Conclusion
And there you have it! All the data is being stored on Victoria Metrics, and Grafana is now able to see that data, and display it!
Just stop the containers by pressing CTRL and C, then execute docker compose up -d to run them in detached mode.
Now you are ready to check some tutorials on how to use Grafana, as it is out of the scope of this blog post :P If you went to all this trouble, consider doing a shout out to me on Mastodon at @[email protected], feel free to ask for help there as well :)